• X
  • Facebook
  • LinkedIn
  • Contact us
  • Login
Safefood 360°
  • More Information
    • Solutions For:
      • Food Safety Management
      • Supplier Quality Management
      • Enterprise Food Safety
      • Audit Management 360
      • Business Intelligence Dashboards
      • Remote Working and Oversight
    • Technology
      • Software Modules
      • Platform & Data Security
      • Available Languages
      • Standards We Support
  • By Industry
    • Bakeries
    • Seafood Processors
    • Beverage Manufacturers
    • Pet Food & Animal Feed
  • Customer Stories
    • Testimonials
    • UK: Butternut Box
    • EU: Royal FrieslandCampina
    • EU: Hofseth
    • USA: Bluegrass Ingredients
  • Support
    • Technical Support
    • Professional Services
    • Customer Success
    • Education & Training
  • Resources
    • ROI Calculator
    • Webinars
    • Whitepapers
    • Datasheets
      • Physical Hazard Series
      • Chemical Hazard Series
      • Microbiological Hazard Series
      • Food Safety Management Series
    • Presentations
    • Ebooks
    • Tools
  • Blog
  • Company
    • About Safefood 360°
    • About LGC Assure
    • Contact Us
  • Demo Request
  • Search
  • Menu Menu
  • More Information
    • Solutions For:
      • Food Safety Management
      • Supplier Quality Management
      • Enterprise Food Safety
      • Audit Management 360
      • Business Intelligence Dashboards
      • Remote Working and Oversight
    • Technology
      • Software Modules
      • Platform & Data Security
      • Available Languages
      • Standards We Support
  • By Industry
    • Bakeries
    • Seafood Processors
    • Beverage Manufacturers
    • Pet Food & Animal Feed
  • Customer Stories
    • Testimonials
    • UK: Butternut Box
    • EU: Royal FrieslandCampina
    • EU: Hofseth
    • USA: Bluegrass Ingredients
  • Support
    • Technical Support
    • Professional Services
    • Customer Success
    • Education & Training
  • Resources
    • ROI Calculator
    • Webinars
    • Whitepapers
    • Datasheets
      • Physical Hazard Series
      • Chemical Hazard Series
      • Microbiological Hazard Series
      • Food Safety Management Series
    • Presentations
    • Ebooks
    • Tools
  • Blog
  • Company
    • About Safefood 360°
    • About LGC Assure
    • Contact Us
  • Demo Request
using data for improving processes

How to use food safety data to improve your processes

in blog

Did you know that your food safety management system contains lots of data that you could use to drive quality and process improvements?

Once a process is in place, and you are using it on a daily basis, it often seems tiresome to step back and examine how the process is working. However, using the Safefood 360° Query Tool in conjunction with some simple Excel formulas and charts can easily tell a story about how the process is working. After some analysis, it can drive quality and safety improvements.

In this blog, I will walk you through one example:

  • Where to find data that is suitable for driving quality and process improvement
  • How to extract the data
  • How to study and analyze the data
  • How to use basic techniques, like standard deviations, to test your assumptions, validate specs and improve your system

You can start with monitoring data

The Monitoring module is an ideal place to pull data and begin your analysis. When you use this module for capturing production data, you will be able to find a wealth of information about your processes.

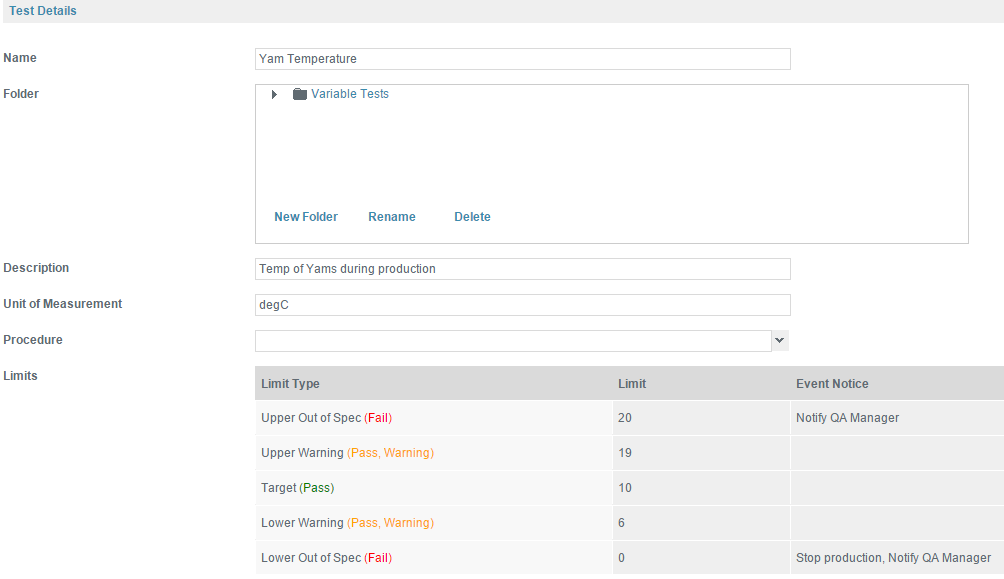
As an exercise, you can look at an example of monitoring Yam production. Specifically, you can look at one test that monitors the temperature of yams. Below is a test that has been set up with upper and lower limits for warning and fail results.

Studying your test specifications

How to export your data using the Query Tool

I’l imagine this test has been used consistently in a monitoring program over the last year.

In the Query Tool, go to Add Query and open up the table MonitoringRecordSampleTestResult. Then pull in the TestValue and TestResult.  Include also the Date of the entire record from the MonitoringRecord table.

Then in the Conditions, add a condition for TestName that starts with “Yam Temp” and any other conditions that may be relevant. For example, new fans or a new process may have been put in place in December of last year. In this case, only data after this change is important to your analysis; data before this date would not be reflective of your current process.

Now, you can execute the query and get a list of all temperature readings since December of last year, the results (pass, pass/warning, or fail) and the date of the test. It may seem simple, but there is a lot that you can do with this data.

Once you save the query, you can export it to Excel, and you can start looking at how your process is fairing. If you need more tips, we have also written blog posts that contain detailed instructions about how to use the Query Tool.

Add trendlines to your line charts

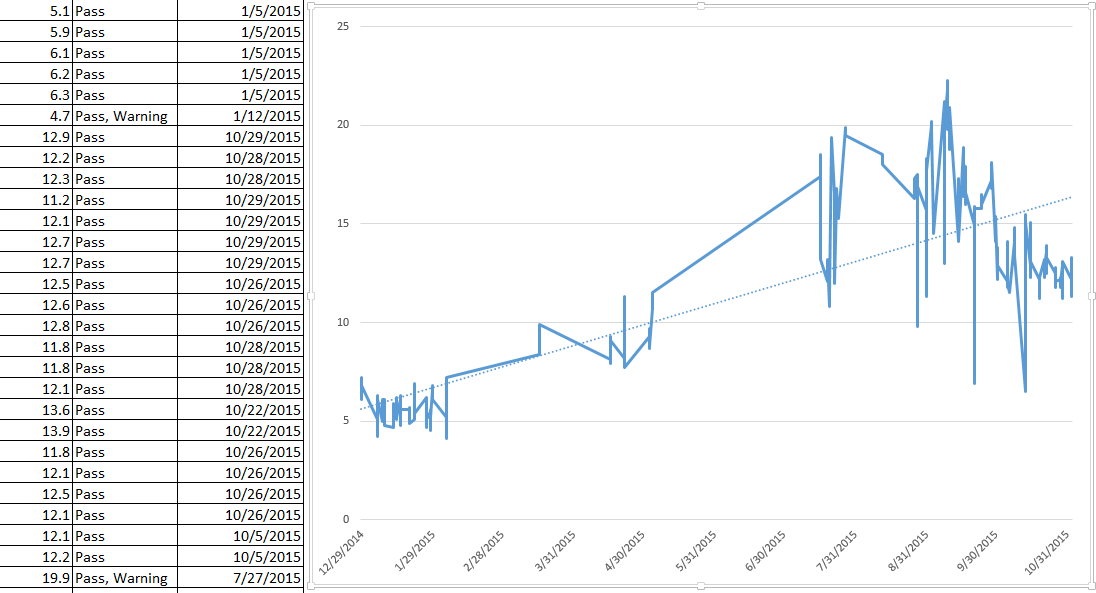
One easy way to examine this data is by creating a line chart of the temperatures over the dates of your results. Also, a trendline has been added by right-clicking on the line and selecting “Add Trendline”.

A trendline showing an upward trend in the data

Several things jump out immediately; first, your yams are getting hotter, and second, the temperature variations are more erratic! What is happening? An obvious answer might be seasonal changes in the weather, but you see a spike in August/September that breaches our 20° C upper limit several times, and this might be peak production time. This chart has already given you two areas for improvement and root cause analysis.

Find out averages and standard deviations

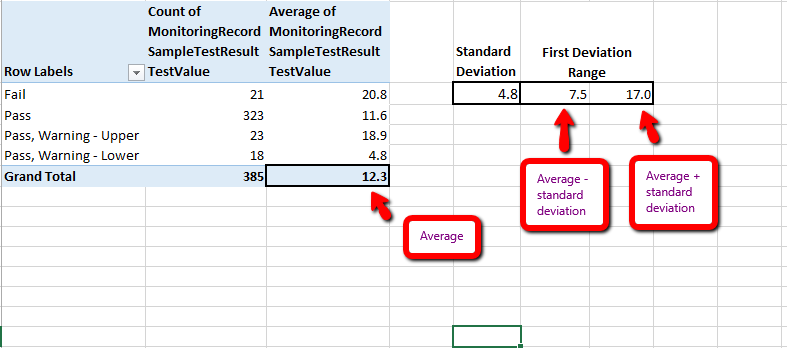
Taking another approach, you can examine your temperature variations and averages using some formulas in Excel. By using the list of results and creating a pivot table, you can see some averages and use standard deviation to examine how erratic your temperature readings truly are.

Looking at standard deviations can reveal problems about your test specifications

The average temperature across all results is 12.3° C. There have been 21 failures averaging 20.8°, 323 passes with an average of 11.6° and an upper and lower pass with a warning of 18.9° and 4.8° respectively.

Note that there are no lower failures, something to keep in mind when you examine your process improvements. Also, you have added a standard deviation using the =STDEV.P formula and discovered that +-4.8 °C will get you your first range of deviations. Standard Deviation follows the 68-95-99 rule; your first deviation means that you have 68% confidence our temperatures will fall between 7.5 (12.3 – 4.8) and 17.0 (12.3 + 4.8) degrees. (This will be different if you just examine those summer months mentioned earlier.)

Now you have some data to start examining the process and set new goals to further your quality and safety initiatives. If you look back at our test specifications you notice that the upper limit is 20° C. There may be nothing you want to do regarding this number as it is set as part of a safety standard or internal quality measure; there is no need to fail any product between your failure range.

Critically examine the limits of your tests

However, it would be possible to drive quality improvements by examining the upper and lower “pass, warning” limits. These are currently set at 19 and 6° C. But, your standard deviation gives you a narrower range of 17 to 7.5°.

Tightening up your range to match your deviations would give you an earlier warning when the numbers start fluctuating outside of the acceptable range and be a good quality goal for your company. Similarly, the average temperature of your yams is 12.3°, 2.3 degrees higher than the optimal temperature of 10° C.

Also, your entire temperature range is skewed higher than need be as you have never had a lower failure and a smaller number of lower warnings than upper. A further goal might be to lower your entire first deviation temperature range from 7.5-17° by 2° to 5.5-15°, especially during the hotter months. Overall, our entire process could be cooler by 2.3° C.

Use data, stop guessing

With these numbers, you have real data-driven process opportunities instead of guesses. You can do a similar analysis of a host of tests – microbiological, metal detection or any other test with a good base of results.

If, in addition to this data, you also had a good lean map of this process, it would be possible to overlay these results on your process and examine how your process is affecting the quality and safety measurements.

Lean, Six Sigma, or other process oriented methodologies along with data analysis similar to that above, can be powerful tools for meaningful process change.

Some commonly used techniques

  • You can use the standard deviation to test the assumptions of your test specs
  • If the standard deviation is very high, it could mean that your devices are poorly calibrated
  • Instead of testing the absolute values, you could trend the categories “Pass, Warning, Fail”
  • You could export datasets from two tests and correlate the results – this way you could test if product temperature is correlated with some other less obvious production values

We hope this quick blog will give you new ideas into how you can use your existing data to drive improvement in quality and food safety! Let us know your thoughts!

Share this entry
  • Share on Facebook
  • Share on X
  • Share on LinkedIn
  • Share by Mail
https://safefood360.com/wp-content/uploads/2015/11/using-data-for-improving-processes.png 454 1368 /wp-content/uploads/2015/04/sf360-logo.png 2015-11-03 16:48:412016-03-16 17:07:23How to use food safety data to improve your processes
0 replies

Leave a Reply

Want to join the discussion?
Feel free to contribute!

Leave a Reply Cancel reply

Your email address will not be published. Required fields are marked *

Recent
  • Webinar Cover Image Play
    [Watch] The Economic Benefits to Food Manufacturers Implementing...
  • Radura Symbol 1
    An Introduction to the basics of Food Irradiation
  • Food Fraud 1
    Protecting Our Food: Effectively Tackling Food Fraud
  • Data security 1
    How we ensure trust and security in our software platfo...
  • The Hidden Costs of Food Safety Non Compliance 7 1
    The Costs of Food Safety Non-Compliance: How to Avoid Financial...
  • PDSA blog cover
    Using the Plan Do Study Act Cycle for Better Food Safety...
  • The Answer To Food Safety Digital Transformation Challenges
    The Challenges of Digital Transformation in Food Safety:...
  • SSO
    What is Single Sign On and why do we offer it?  
  • Alcoa Principles What can the food industry learn from life sciences
    Alcoa+ Principles: What can the food industry learn from...
  • Hero image 3
    Introducing Audit Management 360: Better Food Safety Au...
  • Webinar1 SPC 1058 530
    Unlocking the Power of SPC in Food Safety: A Webinar Re...
  • Webinar 2 Mastering Operational and GMP Auditing A Comprehensive Guide to Best Practices 1058 530
    Unveiling the Secrets to Mastery in Operational & GMP...
  • Safefood 360 is top performer on sourceforge in Summer 2023
    Safefood 360°: Top Performer Summer 2023 at SourceForg...
  • RISK Jun 2023 report
    Food Safety Alert Update (June 2023)
  • RISK May 2023 report
    Food Safety Alert Update (May 2023)
  • sf360 Single sign on
    Should I implement single sign-on (SSO) for food safety...
  • How do Chemical Hazards Occur in the food safety process 1
    How do Chemical Hazards occur in the Food Safety Proces...
  • RISK Apr 2023 report
    Food Safety Alert Update (April 2023) by Safefood 360°...
  • How do Physical Hazards Occur in the Food Safety Process 1
    How do Physical Hazards Occur in the Food Safety Proces...
  • The high cost of Cross contamination in the food sector
    The High Cost of Cross-Contamination in the Food Sector
  • RISK Mar 2023 report
    Food Safety Alert Update (March 2023) by Safefood 360°...
  • RISK Feb 2023 report
    Food Safety Alert Update (February 2023) by Safefood 360°...
  • RISK jan 2023 report
    Food Safety Alert Update (January 2023) by Safefood 360°...
  • Novel Food Regulation
    Novel Food Regulation: EFSA versus FDA
  • RISK Dec 2022 report
    Food Safety Alert Update (December 2022) by Safefood 360°...
  • RISK Nov 2022 report
    Food Safety Alert Update (November 2022) by Safefood 360°...
  • Blog post image 13
    Complete Guide to Food Cooking Temperature Control
  • RISK Oct 2022 report
    Food Safety Alert Update (October 2022) by Safefood 360°...
  • Blog post image 8 1
    7 Ways Compliance Management Platforms Improve Operational...
  • 6 Ways
    6 Ways to Implement Preventive Measures and Controls For...
Popular
  • CCP PRP blog
    Understanding the difference between PRP, OPRP & CCP...
  • fsma harpc guidance
    The difference between HACCP and HARPC. A case of the Emperor’s...
  • Auditing
    New checklist available for TS ISO 22002
  • thanks for c360
    Thank you for Connect 360°
Comments
  • Barry ONeillThank you Cyril! Glad to hear you enjoyed it.31 October 2023 - by Barry ONeill
  • cyril periappuramExcellent presentation, Thank you for your contribution...27 October 2023 - by cyril periappuram
  • Gay KSend me info on what foods and drinks and water having MRA...20 June 2023 - by Gay K
  • AmrikDear Sanika , we want to use one line to be able to ...9 February 2023 - by Amrik
Tags
food safety food standard and legislation Implementation pandemic Professional Services Report RISK Risk Assessment Tool supply chain webinar

Archives

Frame 16

Safefood 360°, built by a group of food safety experts in 2010, is designed to tackle the real difficulties facing food-related industries by combining Food Safety Management and Supplier Quality Management Solutions with over 35 pre-set modules – creating a fast, secure, and audit-ready working environment.

Follow us
  • Link to Facebook
  • Link to X
  • Link to LinkedIn

Solutions

  • Food Safety Management
  • Supplier Quality Management Software
  • StatusBI Business Intelligence
  • Audit Management 360

Support

  • Technical Support
  • Professional Services
  • Password Reset Instructions
  • Accepting an invitation from Safefood 360°
  • Frequently Asked Questions

Resources

  • Whitepapers
  • Technical Data Sheets
  • Webinars
  • Tools
  • Presentations
  • Privacy Policy
© Copyright – Safefood 360°
GlobalGAP Version 5 checklists available in Safefood 360°Auditingharpc all you need to knowHARPC – What you need to know?
Scroll to top